2. Methodology
2.1. Data Sources
2.1.1. The eROSITA Final Equatorial-Depth Survey (eFEDS)
Wide-field X-ray telescopes have been considered advantageous for many years. However, most of today's advanced focusing X-ray telescopes, such as NASA's Chandra and ESA's XMM-Newton, have relatively narrow fields of view. This makes it difficult to quickly map large sections of the Universe. To overcome this, eROSITA was developed as a wide-field X-ray telescope with the ability to capture deep, detailed images over extensive areas of the sky
| [18] | M. Salvato et al., “The eROSITA Final Equatorial-Depth Survey (eFEDS): Identification and characterization of the counterparts to point-like sources,” Astron. Astrophys., vol. 661, pp. 1–32, 2022, https://doi.org/10.1051/0004-6361/202141631 |
[18]
.
The eROSITA Final Equatorial-Depth Survey (eFEDS) is a project aiming to produce a thorough X-ray survey of the entire sky visible from the northern hemisphere. This survey is being carried out using the eROSITA X-ray telescope, which was launched in July 2019 as part of the German-Russian Spectrum-Roentgen-Gamma (SRG) mission
| [19] | P. Predehl et al., “The eROSITA X-ray telescope on SRG,” Astron. Astrophys., vol. 647, 2021, https://doi.org/10.1051/0004-6361/202039313 |
| [20] | H. Brunner et al., “The eROSITA Final Equatorial Depth Survey (eFEDS): X-ray catalogue,” Astron. Astrophys., vol. 661, 2022, https://doi.org/10.1051/0004-6361/202141266 |
[19, 20]
.
The eFEDs survey is designed to cover an area of the sky that is approximately 140 square degrees in size. The eROSITA telescope is capable of detecting X-rays with energies ranging from
to
, and it can be producing detailed maps of the X-ray sky with unprecedented sensitivity and accuracy
| [18] | M. Salvato et al., “The eROSITA Final Equatorial-Depth Survey (eFEDS): Identification and characterization of the counterparts to point-like sources,” Astron. Astrophys., vol. 661, pp. 1–32, 2022, https://doi.org/10.1051/0004-6361/202141631 |
[18]
.
The data collected during the eFEDS survey is being used to study a wide range of astrophysical phenomena, including the distribution of hot gas in clusters of galaxies, the properties of AGN, and the evolution of the large-scale structure of the universe. The survey is also expected to identify tens of thousands of new X-ray sources, many of which will be studied in detail by follow-up observations using other telescopes
| [18] | M. Salvato et al., “The eROSITA Final Equatorial-Depth Survey (eFEDS): Identification and characterization of the counterparts to point-like sources,” Astron. Astrophys., vol. 661, pp. 1–32, 2022, https://doi.org/10.1051/0004-6361/202141631 |
| [20] | H. Brunner et al., “The eROSITA Final Equatorial Depth Survey (eFEDS): X-ray catalogue,” Astron. Astrophys., vol. 661, 2022, https://doi.org/10.1051/0004-6361/202141266 |
[18, 20]
.
The field overlaps with an area enriched by deep optical and near-infrared (NIR) imaging from several major surveys, including the HSC2 Wide Area Survey, KIDS-VIKING, DESI Legacy Imaging Survey, GAMA, WiggleZ, LAMOST, and the SDSS spectroscopic coverage. A comprehensive description of the available multiwavelength data, along with the identification of their counterparts, is presented in
| [18] | M. Salvato et al., “The eROSITA Final Equatorial-Depth Survey (eFEDS): Identification and characterization of the counterparts to point-like sources,” Astron. Astrophys., vol. 661, pp. 1–32, 2022, https://doi.org/10.1051/0004-6361/202141631 |
[18]
.
Based on these advantages, our analysis utilizes X-ray sources from the eFEDS field, detailed in the eFEDS main catalog. This catalog provides information on source positions, extents, and fluxes. It includes 27,910 X-ray sources detected in the
energy band with detection likelihoods of 6 or higher, corresponding to a flux limit of approximately
in the
energy range
.
2.1.2. The Kilo-Degree Survey (KiDS) and VISTA Kilo Degree Infrared Galaxy (VIKING) Imaging Survey
In the clustering analysis, data from the fourth release of the KiDS/VIKING survey was utilized. This dataset includes optical and near-infrared (NIR) photometry, as well as photometric redshift measurements for approximately 100 million galaxies spread across 1006 square degrees
. The Kilo-Degree Survey (KiDS) is an ongoing wide-field imaging project using the OmegaCAM on the VLT Survey Telescope. It aims to study weak gravitational lensing caused by galaxies and the large-scale structure of the Universe. When completed, KiDS will cover 1350 square degrees, using four filters (u, g, r, i)
. This release also incorporates photometric data from the VIKING survey, which is part of the ESO public imaging survey on the VISTA telescope
| [21] | ESO, “New data from the Kilo-Degree Survey: KiDS Data Release 4,” ESO - News and Changes, 2019. https://www.hq.eso.org/sci/observing/phase3/news.html |
| [22] | K. Kuijken et al., “The fourth data release of the Kilo-Degree Survey: Ugri imaging and nine-band optical-IR photometry over 1000 square degrees,” Astron. Astrophys., vol. 625, no. October 2011, pp. 1–25, 2019, https://doi.org/10.1051/0004-6361/201834918 |
| [23] | E. Pouliasis, G. Mountrichas, I. Georgantopoulos, A. Ruiz, M. Yang, and A. Z. Bonanos, “An obscured AGN population hidden in the VIPERS galaxies: Identification through spectral energy distribution decomposition,” Mon. Not. R. Astron. Soc., vol. 495, no. 2, pp. 1853–1873, 2020, https://doi.org/10.1093/mnras/staa1263 |
[21-23]
.
From the outset, KiDS and VIKING were designed as a combined survey, targeting the same regions of the sky. The VIKING survey commenced earlier than KiDS and ended in 2015 without completing its initially planned coverage of 1500 square degrees. Consequently, KiDS prioritized observations over the 1350 square degrees where VIKING data were available
| [22] | K. Kuijken et al., “The fourth data release of the Kilo-Degree Survey: Ugri imaging and nine-band optical-IR photometry over 1000 square degrees,” Astron. Astrophys., vol. 625, no. October 2011, pp. 1–25, 2019, https://doi.org/10.1051/0004-6361/201834918 |
[22]
. For each of the 1006 square-degree survey tiles, the data release contains calibrated, stacked images in the u, g, r, and i filters, along with corresponding weights and masks, and single-band source lists extracted from these stacks. Additionally, the multi-band photometric catalog (ugriZYJHKs) spans these 1006 square-degree tiles, offering PSF-homogenized and aperture-matched photometry as well as photometric redshift estimates
| [22] | K. Kuijken et al., “The fourth data release of the Kilo-Degree Survey: Ugri imaging and nine-band optical-IR photometry over 1000 square degrees,” Astron. Astrophys., vol. 625, no. October 2011, pp. 1–25, 2019, https://doi.org/10.1051/0004-6361/201834918 |
| [23] | E. Pouliasis, G. Mountrichas, I. Georgantopoulos, A. Ruiz, M. Yang, and A. Z. Bonanos, “An obscured AGN population hidden in the VIPERS galaxies: Identification through spectral energy distribution decomposition,” Mon. Not. R. Astron. Soc., vol. 495, no. 2, pp. 1853–1873, 2020, https://doi.org/10.1093/mnras/staa1263 |
[22, 23]
.
2.1.3. The Wide-Field Infrared Survey Explorer (WISE)
NASA’s Wide-field Infrared Survey Explorer (WISE) was launched on December 14, 2009, with the goal of mapping the entire infrared sky for the first time. The mission began on January 14, 2010, and achieved its initial full-sky coverage by July 17, 2010. The spacecraft, weighing around 650 kg, operates in a polar orbit at an altitude of about 525 km above Earth. It is equipped with a 40 cm telescope and four infrared detector arrays, each with over a million pixels, capturing images in the 3.4, 4.6, 12, and 22 μm mid-infrared bands (designated W1, W2, W3, and W4). WISE generated and released a comprehensive Source Catalog, providing precise photometric and astrometric data for over 563 million objects
| [24] | E. L. Wright et al., “The Wide-field Infrared Survey Explorer (wise): Mission description and initial on-orbit performance,” Astron. J., vol. 140, no. 6, pp. 1868–1881, 2010, https://doi.org/10.1088/0004-6256/140/6/1868 |
[24]
.
2.1.4. Materials
In this work, CIGALE-v2022.1 was used to construct spectral energy distributions (SEDs) for the dataset. CIGALE (Code Investigating GALaxy Emission) is a Python-based software that models the emission from galaxies across the electromagnetic spectrum, from ultraviolet to radio wavelengths
. To use CIGALE, several necessary Python packages were installed using Anaconda, including Astropy, NumPy, SciPy, Matplotlib, ConfigObj, and Rich. Astropy is a widely-used package for astronomical calculations, while NumPy and SciPy provide powerful numerical computing capabilities. Matplotlib is a popular package for data visualization, and ConfigObj is used to parse configuration files in CIGALE. Finally, Rich is a Python library for rich text and beautiful formatting in the terminal, which can be used for creating elegant command-line interfaces. Together, these packages enabled us to use CIGALE effectively in our work, and allowed us to analyze and visualize our results efficiently
| [25] | G. Yang et al., “X - CIGALE : fitting AGN / galaxy SEDs from X-ray to infrared 1 I N T RO D U C T I O N,” vol. 757, pp. 740–757, 2020, https://doi.org/10.1093/mnras/stz3001 |
| [26] | J. Comparat et al., “Active galactic nuclei and their large-scale structure: An eROSITA mock catalogue,” Mon. Not. R. Astron. Soc., vol. 21, no. 2, pp. 2005–2029, 2019, https://doi.org/10.1093/mnras/stz1390 |
[25, 26]
.
Additionally, Topcat software was used extensively for data analysis. Topcat is an interactive graphical viewer and editor for tabular data, which allows for the manipulation and visualization of large datasets. The software was utilized to exclude unnecessary objects from the datasets, match X-ray eFEDS with KiDS/VIKING and WISE data, convert AB magnitudes to flux, and generate figures to display the results. Topcat's powerful filtering and sorting capabilities made it possible to easily exclude unnecessary objects from the datasets, which is crucial in any data analysis process. Topcat's ability to match data from different sources and formats was essential in matching X-ray eFEDS with KiDS/VIKING and WISE data, and facilitated the integration of data from different wavelengths. The software's built-in flux conversion tools made it easy to convert AB magnitudes and flux in to flux in mJ, which allowed for the determination of the brightness of objects in the data and facilitated analysis. Finally, Topcat's visualization tools were used to create figures that presented the research results in a clear and concise manner. Overall, the use of Topcat software in this study was an essential component of the data analysis process and played a critical role in the production of high-quality research results.
2.2. Data Manipulation and Processing
The eFEDS main catalog data was obtained from the webpage hosted by the Max-Planck Institute for Extraterrestrial Physics (MPE), dedicated to the eROSITA data release. This catalog contains a large number of X-ray sources detected in a specific energy band. The catalog includes 27,910 sources that were detected with high detection likelihoods
, which indicates a high confidence level in the detection. The corresponding flux limit for these detections is
in the
energy range
| [20] | H. Brunner et al., “The eROSITA Final Equatorial Depth Survey (eFEDS): X-ray catalogue,” Astron. Astrophys., vol. 661, 2022, https://doi.org/10.1051/0004-6361/202141266 |
| [26] | J. Comparat et al., “Active galactic nuclei and their large-scale structure: An eROSITA mock catalogue,” Mon. Not. R. Astron. Soc., vol. 21, no. 2, pp. 2005–2029, 2019, https://doi.org/10.1093/mnras/stz1390 |
[20, 26]
. Next, The dataset was filtered with EXT_LIKE == 0, selecting only point sources detected in the eFEDS field. This filter reduced the number of sources in our dataset to 27,369 or 98% of the main data. The reason why
is necessary to apply is that it helps to remove extended sources, such as galaxy clusters or diffuse emission, from the dataset. These extended sources can contaminate the point source sample and affect the accuracy of the analysis. Therefore, by applying this filter, the dataset includes only point sources that are suitable for further analysis, ensured by applying the EXT_LIKE == 0 filter
| [18] | M. Salvato et al., “The eROSITA Final Equatorial-Depth Survey (eFEDS): Identification and characterization of the counterparts to point-like sources,” Astron. Astrophys., vol. 661, pp. 1–32, 2022, https://doi.org/10.1051/0004-6361/202141631 |
[18]
.
In a recent study by Salvato et al. (2022), multiwavelength counterparts and redshifts of X-ray sources were presented. To identify the optical counterparts of these sources, the DESI Legacy Imaging Survey DR8 (LS8) was used due to its homogeneous coverage of the field and its depth
| [18] | M. Salvato et al., “The eROSITA Final Equatorial-Depth Survey (eFEDS): Identification and characterization of the counterparts to point-like sources,” Astron. Astrophys., vol. 661, pp. 1–32, 2022, https://doi.org/10.1051/0004-6361/202141631 |
| [27] | A. Liu et al., “The eROSITA Final Equatorial-Depth Survey (eFEDS): Catalog of galaxy clusters and groups,” Astron. Astrophys., vol. 661, 2022, https://doi.org/10.1051/0004-6361/202141120 |
[18, 27]
. The LS8 catalog also includes the Global Astrometric Interferometer for Astrophysics (Gaia) and WISE photometry. To find the counterparts of the X-ray sources, two independent methods were employed: NWAY and ASTROMATCH. NWAY is based on Bayesian statistics while ASTROMATCH uses the maximum likelihood ratio. Of the eFEDS point like sources, 88.4% were found to have the same counterpart identified by both methods. Each counterpart is assigned a quality flag,
, which is used to assess the reliability of the identification
| [18] | M. Salvato et al., “The eROSITA Final Equatorial-Depth Survey (eFEDS): Identification and characterization of the counterparts to point-like sources,” Astron. Astrophys., vol. 661, pp. 1–32, 2022, https://doi.org/10.1051/0004-6361/202141631 |
| [28] | G. Mountrichas et al., “Comparison of the star formation of X-ray selected active galactic nuclei in eFEDS with star-forming galaxies,” pp. 1–14, 2022, [Online]. Available: http://arxiv.org/abs/2205.01451 |
[18, 28]
.
Counterparts with a CTP_quality of 2 or higher are considered reliable. This classification includes cases where both methods agree on the counterpart with probabilities above the threshold (CTP_quality = 4 for 20,873 sources), or agree with one method above the threshold (CTP_quality = 3 for 1,379 sources), or when multiple possible counterparts exist (CTP_quality = 2 for 2,522 sources). In total, our analysis used 24,774 counterparts with CTP_quality ≥ 2. However, it's important to note that sources with a CTP_quality of 2 constitute only 5% (42 in total) of our final X-ray sample
| [18] | M. Salvato et al., “The eROSITA Final Equatorial-Depth Survey (eFEDS): Identification and characterization of the counterparts to point-like sources,” Astron. Astrophys., vol. 661, pp. 1–32, 2022, https://doi.org/10.1051/0004-6361/202141631 |
[18]
.
After identifying the counterparts, it is crucial to distinguish between different classes of objects to understand the underlying physical processes and populations. The key distinction is between extragalactic sources (such as galaxies, AGN, and Quasi-Stellar Objects) and galactic sources (like stars and compact objects). To achieve the most reliable classification, Salvato et al. (2022) employed a combination of methods, utilizing spectroscopic data, parallax measurements from Gaia, and colors and morphology from imaging surveys. Each method has its limitations, as they depend on data quality (e.g., signal-to-noise ratio for spectra, and image depth and resolution) and the color-redshift degeneracy for many sources. Therefore, they used a multi-step approach, sequentially classifying sources with high reliability as either extragalactic or galactic. Out of the 24,774 X-ray sources, 20,987 were identified as extragalactic, and galactic sources were excluded from our analysis
| [18] | M. Salvato et al., “The eROSITA Final Equatorial-Depth Survey (eFEDS): Identification and characterization of the counterparts to point-like sources,” Astron. Astrophys., vol. 661, pp. 1–32, 2022, https://doi.org/10.1051/0004-6361/202141631 |
[18]
.
To classify extragalactic and galactic objects, a redshift flag, CTP_REDSHIFT_GRADE, is assigned to each source. In this work, only sources with a CTP_REDSHIFT_GRADE of 3 or higher were considered, accounting for 20,987 out of 24,774 sources in the dataset. This includes sources with a spectroscopic redshift (CTP_REDSHIFT_GRADE = 5), those where the photometric redshift estimates from two methods agree (CTP_REDSHIFT_GRADE = 4), or those where the estimates agree within a tolerance level (CTP_REDSHIFT_GRADE = 3). For more details, refer to Section 6.3 of Salvato et al. 2022
| [18] | M. Salvato et al., “The eROSITA Final Equatorial-Depth Survey (eFEDS): Identification and characterization of the counterparts to point-like sources,” Astron. Astrophys., vol. 661, pp. 1–32, 2022, https://doi.org/10.1051/0004-6361/202141631 |
[18]
.
Approximately 3% of the sources are located at the edge of the field, resulting in shorter exposure times, stronger vignetting, and higher background noise. These sources were excluded from our analysis (using the "inArea90" flag), reducing our dataset to 20,441 sources. Additionally, the analysis was restricted to sources within the KiDS+VIKING area (Kuijken et al., 2019) to enable crossmatching with KiDS/VIKING data. Additionally, the redshift range was further limited to 0.6 ≤ z < 1.5. After applying these criteria, the number of X-ray sources available for our analysis was reduced to 4,714 AGN
| [21] | ESO, “New data from the Kilo-Degree Survey: KiDS Data Release 4,” ESO - News and Changes, 2019. https://www.hq.eso.org/sci/observing/phase3/news.html |
| [22] | K. Kuijken et al., “The fourth data release of the Kilo-Degree Survey: Ugri imaging and nine-band optical-IR photometry over 1000 square degrees,” Astron. Astrophys., vol. 625, no. October 2011, pp. 1–25, 2019, https://doi.org/10.1051/0004-6361/201834918 |
[21, 22]
.
The KiDS/VIKING data utilized in this study was obtained from the ESO Science Archive. To ensure the consistency of the data, the redshift criteria were applied, limiting the range to
to match that of the AGN sample and our KiDS/VIKING sample data becomes 27,443,972. To exclude sources that cover a different area than the AGN sample, TOPCAT software was utilized. After using TOPCAT software to exclude sources covering a different area than the AGN sample, our sample was reduced from 27,443,972 to 1,743,958 objects
| [22] | K. Kuijken et al., “The fourth data release of the Kilo-Degree Survey: Ugri imaging and nine-band optical-IR photometry over 1000 square degrees,” Astron. Astrophys., vol. 625, no. October 2011, pp. 1–25, 2019, https://doi.org/10.1051/0004-6361/201834918 |
[22]
.
The eFEDS data or AGN sample was crossmatched with a galaxy sample. The purpose of this crossmatching was to explore the relationships between the AGN and the galaxies in the sample. The crossmatching process was carried out using TOPCAT software features, which allowed for efficient and accurate identification of matches between the different datasets.
After completing the initial crossmatching process with the KiDS/VIKING dataset, the analysis continued by crossmatching the data with the WISE dataset. Then, our sample reduced to 1413 AGN sample. This additional crossmatching not only for extending our data up to mid infrared but also a more comprehensive understanding of the relationships between the AGN, galaxies, and their associated properties. The TOPCAT software was again used to carry out this crossmatching, and the resulting data was analyzed to identify any patterns or trends that could be relevant to the study.
In addition to the AGN galaxy sample, A reference catalog of non-AGN galaxies was compiled to compare the luminosity, stellar mass, and star formation rate (SFR) of X-ray AGN with non-AGN systems consistently. The fourth data release catalog of the KiDS/VIKING imaging survey (Kuijken et al., 2019) was utilized for this purpose, providing optical and NIR photometry, as well as photometric redshift measurements for approximately 100 million galaxies across 1006 square degrees, along with data from the WISE All-Sky Data Release. This sample was limited to sources within the eFEDS region, applying the same photometric coverage criteria as used for the X-ray sample. Additionally, the redshift range was restricted to 0.6 ≤ z < 1.5. These criteria resulted in a sample of 240,676 galaxies
| [22] | K. Kuijken et al., “The fourth data release of the Kilo-Degree Survey: Ugri imaging and nine-band optical-IR photometry over 1000 square degrees,” Astron. Astrophys., vol. 625, no. October 2011, pp. 1–25, 2019, https://doi.org/10.1051/0004-6361/201834918 |
[22]
.
2.3. Analysis
2.3.1. SED Fitting with CIGALE
An analysis of the multiwavelength data of the targets was conducted to assess various properties of their host galaxies, including stellar masses, star formation rates (SFRs), and luminosities. Additionally, the SED fitting code, Code Investigating GALaxy Emission (CIGALE), as presented by Boquien et al. (2019), was employed
| [25] | G. Yang et al., “X - CIGALE : fitting AGN / galaxy SEDs from X-ray to infrared 1 I N T RO D U C T I O N,” vol. 757, pp. 740–757, 2020, https://doi.org/10.1093/mnras/stz3001 |
| [29] | M. Boquien et al., “CIGALE: A python Code Investigating GALaxy Emission,” Astron. Astrophys., vol. 622, 2019, https://doi.org/10.1051/0004-6361/201834156 |
[25, 29]
. Our analysis utilized CIGALE v2022.1, which builds upon earlier versions of the code, maintaining the same fitting algorithm. For a comprehensive understanding of the code, interested readers can refer to Yang et al. (2022) for detailed descriptions and key features
| [30] | G. Mountrichas et al., “Comparison of star formation histories of AGN and non-AGN galaxies,” Astron. Astrophys., no. 2018, 2022, https://doi.org/10.1051/0004-6361/202244495 |
| [31] | G. Yang et al., “Fitting AGN/Galaxy X-Ray-to-radio SEDs with CIGALE and Improvement of the Code,” Astrophys. J., vol. 927, no. 2, p. 192, 2022, https://doi.org/10.3847/1538-4357/ac4971 |
[30, 31].
CIGALE is a robust spectral energy distribution (SED) fitting code designed for extragalactic research. It enables the incorporation of X-ray flux data into the fitting process and can accurately model the extinction affecting UV and optical emissions, particularly in the context of AGN
| [29] | M. Boquien et al., “CIGALE: A python Code Investigating GALaxy Emission,” Astron. Astrophys., vol. 622, 2019, https://doi.org/10.1051/0004-6361/201834156 |
| [31] | G. Yang et al., “Fitting AGN/Galaxy X-Ray-to-radio SEDs with CIGALE and Improvement of the Code,” Astrophys. J., vol. 927, no. 2, p. 192, 2022, https://doi.org/10.3847/1538-4357/ac4971 |
[29, 31]
.
CIGALE is a software tool that allows users to input a set of model parameters. It generates theoretical spectral energy distributions (SEDs) for every possible combination of these parameters and calculates model fluxes through various filters. By comparing these model fluxes with observed data, CIGALE computes the likelihood
for each model. There are two main types of analyses available in CIGALE: maximum likelihood (minimum
) and Bayesian. In maximum likelihood analyses, CIGALE identifies the model with the highest likelihood (L) and determines physical properties such as luminosity, stellar mass, and star formation rate (SFR) based on this best-fit model. In Bayesian-like analyses, CIGALE computes the marginalized probability distribution function (PDF) for each physical property, considering the likelihood values of all models. It then derives the probability-weighted mean and standard deviation from this PDF, presenting these as the estimated value and uncertainty of the physical property.
| [25] | G. Yang et al., “X - CIGALE : fitting AGN / galaxy SEDs from X-ray to infrared 1 I N T RO D U C T I O N,” vol. 757, pp. 740–757, 2020, https://doi.org/10.1093/mnras/stz3001 |
| [31] | G. Yang et al., “Fitting AGN/Galaxy X-Ray-to-radio SEDs with CIGALE and Improvement of the Code,” Astrophys. J., vol. 927, no. 2, p. 192, 2022, https://doi.org/10.3847/1538-4357/ac4971 |
[25, 31]
.
All available photometry, from X-rays up to mid-infrared, was utilized to construct the SEDs. A grid was created that models both the galaxy and the AGN emission. In particular, sfhdelayed, bc03, nebular, dustatt_modified_CF00, dale2014, skirtor2016, x-ray, and red shifting models were utilized
.
The sfhdelayed model provides a constant star formation rate over time, allowing for easy parameterization and fitting to observational data.
The stellar population synthesis model of Bruzual & Charlot (2003), commonly referred to as bc03, was utilized. This model accurately predicts the spectral energy distribution (SED) of a galaxy based on its star formation history and metallicity. This model is widely used and well-tested in the field. The nebular model accounts for the effects of ionized gas on the SED of a galaxy, allowing for a more accurate estimation of physical properties. The dustatt_modified_CF00 and dale2014 models provide models for dust attenuation, with the latter being more flexible and physically motivated. Specially, the Dale et al. (2014) model utilized for implement the IR SED of the dust heated by stars
| [32] | B. Carroll and D. A. Ostlie, Introduction To Modern Astrophysics. 2014. |
| [31] | G. Yang et al., “Fitting AGN/Galaxy X-Ray-to-radio SEDs with CIGALE and Improvement of the Code,” Astrophys. J., vol. 927, no. 2, p. 192, 2022, https://doi.org/10.3847/1538-4357/ac4971 |
[32, 31]
.
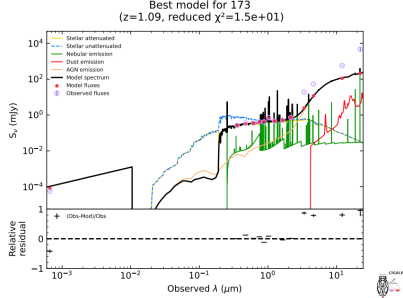
Figure 1 displays various components of the spectral energy distribution (SED). The dust emission is depicted in red, the AGN component in orange, and the attenuated (unattenuated) stellar component is represented by the yellow (blue) solid (dashed) line. The green lines illustrate the nebular emission, while the total flux is indicated in black. Below each SED plot, relative residual fluxes versus wavelength are plotted.
Figure 1. Examples of SED from sources used in our analysis.
As indicated in Table 1, the emission from the active galactic nucleus (AGN) was modeled using the SKIRTOR templates. SKIRTOR is a clumpy two-phase torus model that incorporates an anisotropic disk emission which remains constant. The skirtor2016 model accounts for the effects of dust on the SED of a galaxy, providing more accurate estimations for galaxies with significant amounts of dust. The x-ray model provides a direct measure of the activity of the supermassive black hole in the center of a galaxy, which is crucial for understanding the evolution of galaxies
| [25] | G. Yang et al., “X - CIGALE : fitting AGN / galaxy SEDs from X-ray to infrared 1 I N T RO D U C T I O N,” vol. 757, pp. 740–757, 2020, https://doi.org/10.1093/mnras/stz3001 |
| [33] | G. Mountrichas, V. A. Masoura, E. M. Xilouris, I. Georgantopoulos, V. Buat, and E. D. Paspaliaris, “Star formation of X-ray AGN in COSMOS: The role of AGN activity and galaxy stellar mass,” Astron. Astrophys., vol. 661, 2022, https://doi.org/10.1051/0004-6361/202142792 |
[25, 33]
. Finally, the red shifting model accounts for the effect of redshift on the observed SED of a galaxy, allowing for the estimation of physical properties at different redshifts. Overall, these models are essential for accurately estimating key parameters such as luminosity, stellar mass, and SFR, which are crucial for understanding the formation and evolution of galaxies
| [34] | M. Stalevski, C. Ricci, Y. Ueda, P. Lira, J. Fritz, and M. Baes, “The dust covering factor in active galactic nuclei,” Mon. Not. R. Astron. Soc., vol. 458, no. 3, pp. 2288–2302, 2016, https://doi.org/10.1093/mnras/stw444 |
[34]
. The full list of the models and their parameters used in our analysis are given in
table 1. The constructed SED for our AGN sample is presented in
Figure 1 for this study.
Table 1.
Parameter models and their corresponding values utilized in our SED fitting process with CIGALE. parameter | value |
Star formation history: delayed SFH with optional exponential burst) |
e-folding time of the main stellar population model in | 200, 500, 700, 1000, 2000, 3000, 4000, 5000 |
Age of the main stellar population in Myr | 1500, 2000, 3000, 4000, 5000 |
Age of the late burst in Myr, | 20 |
Mass fraction of the late burst population | 0.0, 0.005, 0.01, 0.015, 0.02, 0.05, 0.10, 0.15, 0.18, 0.20 |
e-folding time of the late starburst population model in | 50 |
Stellar population synthesis model |
Single Stellar Population Library | Bruzual & Charlot (2003) or bc03 |
Initial Mass function | 1 (Chabrier) |
Metallicity | 0.02 |
Nebular emission |
Ionization parameter | -2.0 |
Fraction of Lyman continuum escaping the galaxy | 0.0 |
Fraction of Lyman continuum absorbed by dust | 0.0 |
Line width (FWHM) in | 300 |
Dust attenuation: modified attenuation law Charlot & Fall (2000) |
V-band attenuation in the interstellar medium, | 0.2, 0.3, 0.4, 0.5, 0.6, 0.7, 0.8, 0.9, 1, 1.5, 2, 2.5, 3, 3.5, 4 |
Dust template: Dale et al. (2014) |
AGN fraction | 0.0 |
Alpha slope | 2.0 |
AGN models from Stalevski et al. (2016) (SKIRTOR) |
Average edge-on optical depth at 9.7 micron (t) | 3,7 |
Power-law exponent that sets radial gradient of dust density | 1.0 |
Index that sets dust density gradient with polar angle | 1.0 |
Angle measured between the equatorial plane and edge of the torus | 40 |
Ratio of outer to inner radius, | 20 |
Fraction of total dust mass inside clumps | 0.97 |
Inclination angle | 30,70 |
AGN fraction | 0.0, 0.1, 0.2, 0.3, 0.4, 0.5, 0.6, 0.7, 0.8, 0.9, 0.99 |
Extinction in polar direction, | 0.0, 0.2, 0.4 |
Emissivity of the polar dust | 1.6 |
Temperature of the polar dust | 100.0 |
The extinction law of polar dust | 0 (SMC) |
X-ray module |
Photon index of the AGN intrinsic X-ray spectrum | 1.9 |
Maximum deviation of | 0.2 |
Deviation from the expected low-mass X-ray binary | 0.0 |
Deviation from the expected high-mass X-ray binary | 0.0 |
2.3.2. Assessment of Fitting Results Quality and Reliability
The technique gives a pair of estimates for each parameter that was determined through SED fitting. One estimate of a parameter represents the likelihood-weighted mean value derived from its probability density function, marginalized over all other parameters (Bayesian value), while the other estimate of a parameter is generated using the best-fit model (best value). The weight is based on the likelihood,
, associated with each model
| [18] | M. Salvato et al., “The eROSITA Final Equatorial-Depth Survey (eFEDS): Identification and characterization of the counterparts to point-like sources,” Astron. Astrophys., vol. 661, pp. 1–32, 2022, https://doi.org/10.1051/0004-6361/202141631 |
| [29] | M. Boquien et al., “CIGALE: A python Code Investigating GALaxy Emission,” Astron. Astrophys., vol. 622, 2019, https://doi.org/10.1051/0004-6361/201834156 |
[18, 29]
. If there is a significant gap between both of the estimated value, the source should be excluded and the probability density function (PDF) is likely asymmetric or more complex shaped. Therefore, to exclude sources with unreliable measurements from the analysis, only sources where
and
fall within the range of
to
were considered. Here,
and
are the best fit values of
and
, respectively, and
and
are the Bayesian values, estimated by CIGALE. This criterion results in a reduction of the number of X-ray sources to 1000. To ensure the exclusion of systems with unreliable measurements of the host galaxy properties, the method described in Mountrichas et al. (2021) was implemented. his method involves visually inspecting the spectral energy distributions (SEDs) and excluding poorly fitted SEDs. Specifically, only sources with a reduced
were included in the analysis. This criterion reduced our sample into 804 (about 80% of the first data). Raising the threshold to
increases our sample size by approximately 7%, but most of these additions exhibit poor fits, leading to unreliable host galaxy measurements. Conversely, lowering the threshold to
would exclude additional sources, with the majority having reliable fits. Specifically, this criterion results in the elimination of 82 AGN, constituting 8% of the sample
| [18] | M. Salvato et al., “The eROSITA Final Equatorial-Depth Survey (eFEDS): Identification and characterization of the counterparts to point-like sources,” Astron. Astrophys., vol. 661, pp. 1–32, 2022, https://doi.org/10.1051/0004-6361/202141631 |
| [28] | G. Mountrichas et al., “Comparison of the star formation of X-ray selected active galactic nuclei in eFEDS with star-forming galaxies,” pp. 1–14, 2022, [Online]. Available: http://arxiv.org/abs/2205.01451 |
| [36] | G. Mountrichas, V. Buat, G. Yang, M. Boquien, D. Burgarella, and L. Ciesla, “X-ray flux in SED modelling: An application of X-CIGALE in the XMM-XXL field,” Astron. Astrophys., vol. 646, pp. 1–17, 2021, https://doi.org/10.1051/0004-6361/202039401 |
[18, 28, 36].
2.3.3. Identification of Non-X-ray AGN Systems
As stated in Section 2.3.1, when fitting the galaxy reference catalogue using the SED fitting analysis, an AGN template (SKIRTOR) was also incorporated. This allows us to measure the AGN fraction parameter, fracAGN, and identify systems with a significant AGN component. fracAGN is the ratio of the AGN's infrared emission to the galaxy's overall infrared emission
. Galaxies with fracAGN > 0.2 are not included in the reference catalog. Approximately 99% of sources in the galaxy catalogue are rejected. This criterion has the potential to significantly impact our dataset by removing a substantial number of galaxies
| [28] | G. Mountrichas et al., “Comparison of the star formation of X-ray selected active galactic nuclei in eFEDS with star-forming galaxies,” pp. 1–14, 2022, [Online]. Available: http://arxiv.org/abs/2205.01451 |
[28]
. As a result, it would considerably reduce the overall sample size. However, the implications of this criterion can be examined from two perspectives. Firstly, employing an alternative method may introduce errors that could potentially affect the identification of AGN. Secondly, this criterion demonstrates that our galaxy sample encompasses a substantial presence of AGN. In the broader context, our primary objective is to compare AGN and non-AGN populations, where the reduction in the number of non-AGN galaxies is not expected to have a substantial significant impact
| [28] | G. Mountrichas et al., “Comparison of the star formation of X-ray selected active galactic nuclei in eFEDS with star-forming galaxies,” pp. 1–14, 2022, [Online]. Available: http://arxiv.org/abs/2205.01451 |
[28]
. In our work only 2889 (about 1%) sources were included.
3. Result and Discussion
In this chapter, the results of the study on the contribution of host galaxy properties to X-ray active galactic nuclei (AGN) clusters are presented. The objectives were to examine the dependence of AGN clusters on luminosity, stellar mass, and star formation rate, and to compare AGN clusters with normal galaxy clusters. Multiwavelength galaxy data from X-ray to mid-infrared were incorporated to gain a comprehensive understanding of AGN cluster properties. The CIGALE code was employed to estimate the star formation rate, luminosity, and stellar mass of the host galaxies. This section presents the analysis results on the dependence of AGN clusters on luminosity, stellar mass, and star formation rate, along with a comparison of AGN cluster properties with non-AGN clusters to elucidate the unique features of AGN host galaxies.
To further investigate the dependence of AGN clusters on host galaxy properties, the sample was divided into two redshift subsamples: a low-redshift group comprising 393 AGN galaxies ranging from 0.6 to 1.05, and a high-redshift group comprising 411 AGN galaxies ranging from 1.05 to 1.5. This division allowed for controlling the effects of redshift on the results and examining whether the dependence of AGN clusters on host galaxy properties varies with redshift. Host galaxy properties such as luminosity, star formation rate, and stellar mass were then segmented into smaller intervals to explore their respective impacts on AGN clusters.
3.1. Dependance of AGN Clusters on Luminosity
The dependence of AGN clusters on luminosity was explored to understand their properties and behavior. To effectively analyze this dependence, the luminosity range was divided into smaller bins for both low and high redshifts. This approach allows for examining the characteristics and trends of AGN clusters across different luminosity levels with greater precision. Segmenting the data in this manner enables exploration of how AGN distributions or properties vary as luminosity changes.
Table 2. The properties of the X-ray AGN subsamples, using different Luminosity cuts.
| Low-redshift (0.6-1.05) | High-redshift (1.05-1.5) |
Luminosity ((log (ergs/s)) | 44-45 | 45-46 | 46-47 | 44-45 | 45-46 | 46-47 |
Mean of Luminosity (ergs/s) | 44.782 | 45.508 | 46.198 | 44.913 | 45.749 | 46.22 |
Number of AGN | 54 | 295 | 44 | 3 | 230 | 178 |
Mean of stellar mass (log (sol mass)) | 9.716 | 10.55 | 11.226 | 9.83 | 10.786 | 11.135 |
Mean of logSFR | 1.864 | 2.362 |
Total number of AGN | 393 | 411 |
Table 2 present our findings effectively and allows us to evaluated several key parameters in the various combination of redshift categories, Within each luminosity bin. First, the population of AGN clusters was examined by determining the number of clusters falling within each luminosity range and calculating the mean stellar mass in each luminosity bin. This provides insights into the distribution and abundance of AGN clusters and shows the stellar mass at different luminosity levels. Secondly, present the mean value of star formation rate to compare their values corresponds to high and low redshift.
As shown in
table 2, Our analysis of AGN clusters at various luminosity levels has revealed significant differences in the population of AGN based on luminosity. Notably, a significant proportion of AGN clusters are concentrated in the middle range of luminosity
for both low and high redshift classifications. To further understand these differences, the data can be examined in terms of percentages.
At low redshift, in the luminosity bin, there are 54 AGN out of a total of 393, accounting for approximately 13.7% of the population. In the luminosity bin, there are 295 AGN out of 393, representing about 75.1% of the population. Finally, in the luminosity bin, there are 44 AGN out of 393, constituting around 11.2% of the population. Similarly, at high redshift, the bin consists of 3 AGN out of 411, making up roughly 0.7% of the population. The bin contains 230 AGN out of 411, accounting for approximately 55.9% of the population. Lastly, in the bin, there are 178 AGN out of 411, representing about 43.3% of the population. These percentages shed light on the distribution of AGN populations and highlight the variations observed across different luminosity bins.
When comparing the luminosity bins in the low and high redshift ranges, several important points emerge. Firstly, at low redshift, the majority of AGN clusters are concentrated in the luminosity bin, accounting for 75.1% of the population. In contrast, at high redshift, the luminosity bin remains the most populated, but to a lesser extent, with 55.9% of the population. Secondly, in both redshift ranges, the luminosity bin exhibits the lowest population percentage. However, the difference between low and high redshifts is significant, with 13.7% at low redshift and only 0.7% at high redshift. Lastly, the luminosity bin shows significantly different population percentages at both low and high redshifts, with 11.2% and 43.3%, respectively. These comparisons suggest a shift in the distribution of AGN populations as redshift increases, with a decrease in the low luminosity range and an increase in the high luminosity range.
The results presented in this study provide valuable insights into the physical interpretation of AGN populations at different luminosity levels and redshifts. The high concentration of AGN clusters in the middle range of luminosity suggests that this particular luminosity regime may play a crucial role in the formation and evolution of AGN. The observed differences in AGN populations at different luminosity levels could be attributed to various factors, such as the availability of gas reservoirs for accretion, the presence of active galactic nuclei triggering mechanisms, and the interplay between AGN feedback and host galaxy properties. Additionally, the variations observed between low and high redshifts indicate that the evolution of AGN populations is influenced by the cosmic environment and the underlying physical processes occurring over cosmic time. Further investigations, including multi-wavelength studies and theoretical modeling, will be essential to deepen our understanding of these complex phenomena and their implications for galaxy evolution and the growth of supermassive black holes.
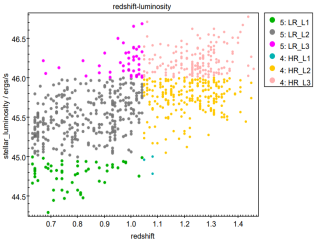
Figure 2 illustrates the relationship between luminosity (L) and the number of AGN clusters corresponding to redshift. where LR refers the lower redshift and HR refers high redshift; L1, L2, L3, L4 are the luminosity bins of our sample in range between
. for example, LR_L1 (green) shows the distribution of x-ray AGN galaxies in the low redshift those have less
than luminosity.
Figure 2. The distribution of x-ray AGN in redshift-luminosity plane.
In the analysis of AGN clusters at different luminosity levels, a consistent increase in the mean value of stellar mass was observed corresponding to increasing luminosity in both low and high redshifts. This positive correlation suggests that AGN with higher luminosities tend to be hosted by galaxies with larger stellar masses.
However, a fascinating observation arises when comparing the mean stellar mass values of the lowest and highest luminosity bins to that of the middle bin. Surprisingly, the mean stellar mass in both the first and last ranges of luminosity approaches the value found in the middle range.
One possible implication for this convergence is the interplay between AGN activity and host galaxy properties. While it is generally expected that higher luminosity AGN would be associated with more massive host galaxies due to increased gas reservoirs and potentially enhanced accretion rates, there may exist a subset of AGN in the lowest luminosity bin that are hosted by galaxies with comparable stellar masses.
These AGN might exhibit unique characteristics or undergo distinct accretion mechanisms that allow them to maintain similar stellar masses despite lower luminosities. This Fascinating result suggests that there may be underlying factors influencing the relationship between AGN luminosity and stellar mass, beyond a simple linear correlation.
In conclusion, our analysis demonstrates a consistent increase in the mean value of stellar mass with increasing luminosity in AGN clusters at both low and high redshifts. However, the convergence of mean stellar mass values between the lowest and highest luminosity bins suggests the presence of additional factors influencing the relationship between AGN luminosity and stellar mass. Further investigations that account for redshift dependencies and involve larger and more diverse AGN samples will shed light on the intricate connections between AGN properties, host galaxy characteristics, and the broader context of cosmic evolution.
3.2. Dependance of AGN Cluster on Stellar Mass
The dependance of AGN cluster on stellar mass is very crucial thing in studying AGN in many perspectives’ way. Therefore, to demonstrate their relationship and dependence, the method previously employed for AGN cluster dependence on luminosity was followed. The methods employed in this section, involving the division of our sample into low and high redshift subsets, followed by the segmentation of estimated stellar mass into small bins, has allowed us to effectively investigate the dependence of AGN clustering on stellar mass while reducing the potential impact of redshift on our analysis. Splitting the sample based on redshift allows for examining AGN populations across different cosmic eras, providing insights into the evolution of AGN clustering over time.
Furthermore, the subdivision of estimated stellar mass into small bins has enabled a detailed examination of the effect of stellar mass on the distribution of AGNs within each bin. This approach ensures that the influence of stellar mass on AGN clustering is not obscured by the averaging effect of larger mass intervals. Additionally, calculating the mean star formation rate (SFR) at each stellar mass bin allows investigation of any correlations or trends between AGN activity and the SFR of the host galaxies. This enhances the robustness and reliability of the findings, providing a comprehensive understanding of the dependence of AGN clusters on stellar mass.
Table 3 present our findings effectively and allows us to evaluated several key parameters in the various combination of redshift categories, Within each stellar mass bin. First, the population of AGN clusters was examined by determining the number of clusters falling within each stellar mass range and calculating the mean value of SFR at each bin. This provides insights into the distribution and abundance of AGN clusters at different stellar mass levels. Secondly, present the mean value of Luminosity to compare their values corresponds to high and low redshift.
Table 3. The properties of the X-ray AGN subsamples, using different stellar mass.
| Low-redshift (0.6-1.05) | High-redshift (1.05-1.5) |
Stellar mass () | <10 | 10-11 | 11-12 | <10 | 10-11 | 11-12 |
Mean of Stellar mass ( | 9.746 | 10.549 | 11.23 | 9.847 | 10.737 | 11.024 |
Number of AGN | 89 | 219 | 85 | 5 | 227 | 179 |
Mean of SFR | 1.53 | 1.99 | 2.04 | 1.5 | 2.313 | 2.623 |
Mean of Luminosity (ergs/s) | 45.69 | 46.05 |
Total number of AGN | 393 | 411 |
Based on the results of our study, it was found that galaxies hosting active galactic nuclei (AGNs) detected in X-ray emission tend to reside or be more prevalent within a specific stellar mass range. Specifically, the range of stellar mass considered in our study was between 10 and 11 (measured in ). This range was found to be populated by a significant proportion of AGN galaxies, regardless of their redshift classification.
In the low redshift region, smaller stellar mass bins (9-10 in )), constituting approximately 22.6% of the AGN population, exhibit a relatively lower representation. The middle stellar mass bin (10-11 in )) stands out with the largest share, accounting for 55.7% of the AGN population. Surprisingly, the high stellar mass bins (have a relatively lower presence, comprising only 21.6% of the AGN population. Moving to the high redshift region, a contrasting distribution was observed. The smaller luminosity bins demonstrate a significantly reduced representation, constituting merely 1.2% of the AGN population. Similar to the low redshift region, the middle luminosity bin (10-11) dominates the AGN population, encompassing 55.2% of the total. However, in this case, the high luminosity bins (11-12) show a relatively higher presence, accounting for 43.5% of the AGN population.
The range of stellar mass considered in our study was between 10 and 11 (measured in ) is found to be populated by a significant proportion of AGN galaxies, regardless of their redshift classification. In the low redshift subset (redshifts less than 1.05), approximately 55.7% of the AGN galaxies were found to be distributed within the specified stellar mass range. Similarly, in the high redshift subset, about 55.2% of the AGN galaxies were also populated within this range. This suggests that the distribution of AGN galaxies, in terms of their stellar mass, is consistently prominent within this specific range across both low and high redshift populations.
The physical interpretation of this finding could be that there is a preferred stellar mass range within which AGN activity is more likely to occur. Galaxies within this range might possess certain characteristics or conditions that promote the growth and activity of supermassive black holes at their centers, leading to the observed AGN emission in X-rays. The stability of this trend across different redshifts further indicates that the preference for a specific stellar mass range is not strongly influenced by cosmic time, at least within the redshift range studied.
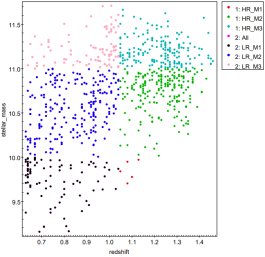
Figure 3. The distribution of x-ray AGN in redshift-stellar mass plane.
In
figure 3, the relationship between stellar mass and the number of AGN clusters corresponding to redshift is shown. where LR refers the lower redshift and HR refers high redshift; M1, M2, M3, M4 are the stellar mass at different bins of our sample from 9-12
. for example, HR_M1 (red) shows the distribution of x-ray AGN galaxies in the high redshift those have less 10 (
) stellar mass.
When comparing the first range (9-10 in )) of high redshift and low redshift, it was observed that the lowest stellar mass range was rarely populated by X-ray AGN galaxies, particularly in the high redshift subset. In contrast, a larger proportion of AGN galaxies were found within this lowest stellar mass range in the low redshift subset.
This finding indicates that, at the lower end of the stellar mass spectrum, the prevalence of X-ray AGN activity is more pronounced in galaxies at low redshifts while it is relatively rare in the high redshift population. Conversely, at higher end of the stellar spectrum, AGN galaxies more populated in the higher redshift while less populated in low redshift. The discrepancy in AGN population between the low and high redshifts within this lower stellar mass range and higher end range could be attributed to various factors associated with the evolution of galaxies and their black holes over cosmic time. It is possible that environmental effects, gas availability, or other triggering mechanisms differ between the two redshift regimes, resulting in a higher abundance of X-ray AGN galaxies within this particular stellar mass range in the low redshift subset and a scarcity in the high redshift subset.
Another point observed from our results is that the mean value of stellar mass at each bin nearly approaches the middle range values. for example, the mean value of galaxies stellar mass 9.746 and 11.3 for left and right range in low redshift classification respectively.
The analysis of the mean value of the star formation rate (SFR) at each bin provides insights into the relationship between SFR and stellar mass, considering different redshift regions. The results indicate a positive correlation between SFR and stellar mass in both redshift regions, suggesting that galaxies with higher stellar masses tend to exhibit higher levels of star formation.
However, when examining the impact of redshift on this relationship, some interesting patterns emerge. In the ranges of stellar mass 10-11 and 11-12, the mean value of SFR is found to be greater in the high redshift region compared to the low redshift region. This suggests that, for galaxies with stellar masses within these ranges, the star formation rates are generally higher at higher redshifts. It implies that the conditions or processes driving star formation are more conducive or active in galaxies at earlier cosmic eras.
Conversely, in the 9-10 range of stellar mass, the mean value of SFR is observed to be slightly lower in the high redshift region compared to the low redshift region. This suggests that, for galaxies within this specific stellar mass range, the star formation rates are somewhat lower at higher redshifts. It could imply that the factors influencing star formation in galaxies of this mass range differ between low and high redshifts, leading to variations in the observed mean SFR.
These findings highlight the complex interplay between stellar mass, redshift, and star formation rates in galaxies hosting AGNs. The positive correlation between SFR and stellar mass suggests that the availability of gas and the ability to form stars are influenced by the galaxy's mass. However, the impact of redshift indicates that additional factors related to cosmic evolution, such as gas supply, environmental conditions, or merger rates, play a role in shaping the observed SFR at different redshifts and stellar mass ranges.
3.3. Dependance of AGN Cluster on Star Formation Rate
In this section, the relationship between X-ray active galactic nucleus (AGN) clusters and the star formation rate (SFR) is examined. The same methodology as in the previous section is employed to investigate the impact of SFR on X-ray AGN clusters.
Table 4. The properties of the X-ray AGN subsamples, using different SFR.
| Low-redshift (0.6-1.05) | High-redshift (1.05-1.5) |
SFR | -0.5-0.5 | 0.5-1.5 | 1.5-2.5 | 2.5-3.5 | -0.5-0.5 | 0.5-1.5 | 1.5-2.5 | 2.5-3.5 |
Mean of SFR | 0.08 | 1.23 | 1.96 | 2.665 | - | 1.381 | 2.199 | 2.696 |
Number of AGN | 4 | 67 | 294 | 28 | 0 | 4 | 266 | 141 |
Mean of Luminosity (log(ergs/s)) | 44.777 | 44.88 | 45.557 | 46.282 | - | 44.947 | 45.794 | 46.265 |
Stellar-mass ( | 10.515 | 10.93 |
Total number of AGN | 393 | 411 |
Firstly, AGN galaxies are categorized based on their redshift into two groups: low redshift (less than 1.05) and high redshift (greater than 1.05). Next, the SFR values are divided into smaller intervals or bins. Subsequently, the number of X-ray AGN falling within each bin is determined, and the average SFR and luminosity values for these AGN are calculated. This analysis allows assessment of the correlation between luminosity and SFR. Finally, prior to discussing the findings, the obtained results are presented in
Table 4, providing an overview of the estimated outcomes.
Our findings reveal several crucial points regarding the distribution of X-ray AGN with respect to the star formation rate (SFR). Notably, a significant population of X-ray AGN is concentrated within the SFR range of 1.5-2.5 (expressed in units of log (/ in both the low and high redshift regions.
This concentration suggests a favorable condition for the emergence of X-ray AGN within this particular SFR range.it implies that a particular range of star formation activity may contribute significantly to the triggering or fueling of AGN activity.
In the low redshift region, an interesting trend is observed where the population of X-ray AGN in the fourth SFR range (2.5-3.5) is nearly half that of the second range (0.5-1.5). Moreover, the first SFR bin (-0.5-0.5) exhibits a significantly lower number, with only four X-ray AGN. Interestingly, in the high redshift region, no AGN galaxies are found within the first SFR bin. The concentration of AGN galaxies in the third and fourth bins (1.5-2.5 and 2.5-3.5, respectively) at high redshift warrants further investigation into the factors influencing AGN formation and evolution in these specific SFR ranges.
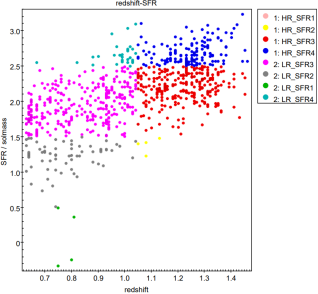
Figure 4. The distribution of x-ray AGN in redshift-SFR plane.
In
figure 4, the relationship between SFR and the number of AGN clusters corresponding to redshift is shown. where LR refers the lower redshift and HR refers high redshift; SFR1, SFR2, SFR3 and SFR4 are the SFR at different bins of our sample from -0.5 to 3.5
. for example, HR_SFR4 (blue) shows the distribution of x-ray AGN galaxies in the high redshift those have SFR value in range between 2.5 to 3.5 (in
log (SFR)).
Furthermore, our analysis indicates a positive correlation between the mean luminosity and SFR in both redshift regions. However, upon comparison, it is observed that the higher redshift region exhibits a higher mean luminosity. This discrepancy may be attributed to various factors, such as differences in the physical conditions, evolutionary stages, or environmental properties between the low and high redshift AGN populations. Further exploration is required to ascertain the underlying reasons behind this disparity in luminosity. Lastly, it was found that the stellar mass tends to be higher in the high redshift region compared to the low redshift region. This observation aligns with general expectations, as higher redshift AGN often exhibit more massive stellar components.
Additionally, our analysis indicates a higher population of AGN galaxies in the low SFR range compared to the higher redshift region, indicating potential variations in the AGN demographics and evolutionary pathways across different redshifts.
The physical interpretation of our results reveals important insights into the relationship between X-ray AGN and star formation rate (SFR). The concentration of X-ray AGN in the SFR range of 1.5-2.5 suggests a favorable condition for AGN activity. This indicates that a specific range of star formation activity may play a significant role in triggering or fueling AGN. The differences in population distribution across SFR bins and redshift regions suggest varying mechanisms and conditions driving AGN activity. In the low redshift region, a higher population of AGN in the third SFR range implies distinct processes at this SFR levels. In the high redshift region, the absence of AGN in the lowest SFR bin and concentration in the third and fourth bins highlight the importance of considering star formation in AGN formation and evolution. The positive correlation between mean luminosity and SFR suggests a connection between star formation and AGN energy output, with higher redshift AGN exhibiting higher luminosity. Additionally, the higher stellar mass in the high redshift region aligns with expectations, indicating a relationship between AGN activity, star formation, and galaxy evolution.
These physical interpretations enhance our understanding of the complex interplay between AGN and star formation processes in different cosmic environments.
3.4. Comparing the AGN Galaxy Clusters with Normal Galaxy Clusters
In this section, the clustering of X-ray selected AGN is compared with that of normal galaxies. A dataset comprising 804 X-ray AGN and 2880 galaxies with available KiDS/VIKING+WISE photometry was utilized. Galaxy samples were constructed to match the stellar mass, luminosity, and SFR distribution of the X-ray dataset for comparison.
Comparing the clustering of X-ray selected AGN with that of normal galaxies is important because it can provide insights into the physical processes that drive the formation and evolution of AGN. AGN are believed to be powered by accretion onto supermassive black holes at the centers of galaxies. The properties and distribution of AGN may therefore be closely linked to the large-scale structure of their host galaxies.
Constructing galaxy samples that match the stellar mass, luminosity, and SFR distribution of the X-ray dataset allows us to control for potential biases. This ensures that any differences in clustering observed are attributed to the presence of an AGN rather than differences in galaxy properties. If the clustering of X-ray selected AGN is found to differ significantly from that of normal galaxies, it would suggest that the presence of an AGN is affecting the large-scale structure of the host galaxy. This comparison can also provide constraints on models of AGN feedback, which is thought to play a crucial role in regulating star formation and galaxy evolution. Understanding how AGN feedback interacts with the surrounding gas and affects the distribution of matter on large scales is essential for developing a comprehensive picture of galaxy evolution.
Comparison upon Luminosity
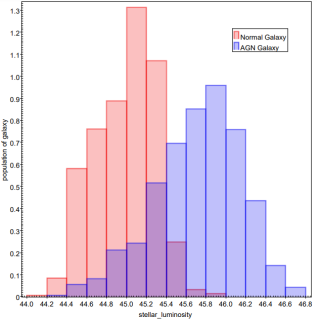
Our finding shows that the clustering of normal galaxies and X-ray AGN shows similar dependence on galaxy properties, but with different luminosity distributions, is fascinating and provides valuable insights into the nature of AGN and their host galaxies. The AGN distribution is peak at higher luminosity while the normal galaxy distribution is peak at lower luminosity. Let's interpret this result further:
Similar dependence on galaxy properties shows the fact that both normal galaxies and X-ray AGN exhibit a similar dependence on galaxy properties in terms of clustering suggests that common underlying mechanisms may be at play. This implies that the physical processes governing the formation and evolution of galaxies, such as the growth of structures and environmental influences, are likely to have a similar impact on both normal galaxies and those hosting AGN.
Different luminosity distributions show the difference in luminosity distributions between normal galaxies and X-ray AGN indicates a distinct characteristic associated with AGN activity. The peak in AGN galaxy distribution at higher luminosities suggests that AGN tend to reside in galaxies with more intense or enhanced accretion onto supermassive black holes, resulting in higher energy outputs. This aligns with the notion that AGN are fueled by the accretion of substantial amounts of material onto the central black hole, leading to the release of enormous amounts of radiation.
Figure 5. Stellar Luminosity of normalized distributions of the AGN (red) and the normal galaxies (blue).
Another key point is that AGN as a result of galaxy evolution; the higher luminosity peak in the AGN galaxy distribution suggests that AGN activity is more prevalent in galaxies with a certain level of mass or evolutionary stage.
This result supports the idea that AGN activity is a consequence of galaxy evolution, where specific conditions or stages trigger the onset of AGN. It is possible that processes such as galaxy mergers, interactions, or the build-up of mass through cosmic accretion play a role in fueling AGN and driving them to higher luminosities.
Additionally, the difference in luminosity distributions between normal galaxies and AGN has implications for AGN feedback. AGN feedback refers to the processes through which AGN activity can influence the surrounding gas, regulate star formation, and impact the growth of the host galaxy. The higher luminosity AGN may have a more significant impact on their environment due to their increased energy output. This suggests that high-luminosity AGN could potentially have a stronger influence on quenching star formation or shaping the properties of their host galaxies through feedback processes.
Totally, the finding of similar clustering dependence on galaxy properties but distinct luminosity distributions between normal galaxies and X-ray AGN provides insights into the connection between AGN activity and galaxy evolution. The higher luminosity peak in the AGN galaxy distribution indicates the prevalence of more intense AGN activity in galaxies with specific characteristics, suggesting a connection between AGN and galaxy evolution processes. Understanding this relationship is crucial for unraveling the role of AGN in shaping the properties and large-scale structure of their host galaxies.
Comparison upon stellar mass
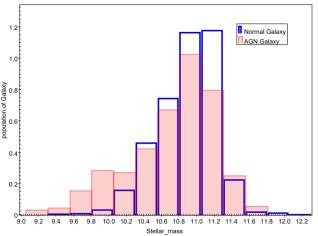
Secondly, the comparison of AGN and normal galaxies is presented based on the stellar mass of the host galaxy. Our analysis reveals a fascinating pattern in the distribution of active galactic nuclei (AGN) and normal galaxies based on their stellar mass (see
figure 7). It appears that the peak of AGN distribution occurs at lower stellar masses, specifically up to a logarithm of 10.3 in
units. In contrast, the distribution of normal galaxies reaches its peak at higher stellar masses, specifically up to a logarithm of 11.3. Remarkably, despite the transition to normal galaxies, the AGN population remains more abundant than that of normal galaxies.
This finding has significant physical implications. The higher occurrence of AGN at lower stellar masses suggests that there is a connection between the growth of supermassive black holes and the early stages of galaxy formation. AGN are known to be powered by accretion onto supermassive black holes, which release tremendous amounts of energy and influence the surrounding environment. The prevalence of AGN in this lower stellar mass range suggests that the black hole growth mechanism plays a vital role in shaping the properties and evolution of galaxies during their early stages.
On the other hand, the dominance of normal galaxies at higher stellar masses indicates a transition towards a more quiescent phase of galaxy evolution. As galaxies grow and accumulate stellar mass over time, the AGN activity tends to diminish, leading to a decline in the AGN population. This shift may indicate a decline in gas supply for black hole accretion or the stabilization of the galactic environment, resulting in reduced AGN activity.
Figure 6. Stellar mass of normalized distributions of the AGN (red) and the normal galaxies (blue).
In summary, our findings reveal a distinct distribution of AGN and normal galaxies with respect to stellar mass. The higher prevalence of AGN at lower stellar masses suggests a link between black hole growth and early galaxy formation, while the dominance of normal galaxies at higher stellar masses indicates a transition to a more quiescent phase of galaxy evolution. this work provides valuable insights into the interplay between supermassive black holes and their host galaxies, shedding light on the mechanisms that drive galaxy growth and evolution.
Comparison upon star formation Rate
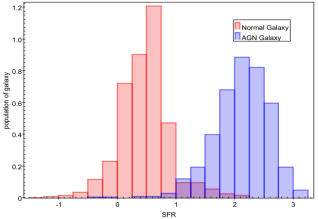
Figure 7. Star formation Rate (SFR) of normalized distributions of the AGN (blue) and the normal galaxies (red).
Our analysis reveals that the distribution of active galactic nuclei (AGN) galaxies peaks at higher star formation rates (SFR) (see
figure 7), while the distribution of normal galaxies is higher at lower SFR. This finding suggests a critical distinction between the two populations based on their star formation activity. The physical interpretation of this result is that AGN galaxies exhibit a higher level of ongoing star formation compared to normal galaxies. AGN are known to be fueled by the accretion of material onto supermassive black holes, which releases significant amounts of energy and can influence star formation processes within galaxies. The higher occurrence of AGN galaxies at higher SFR suggests a strong connection between AGN activity and the presence of actively forming stars.
One possible explanation is that the accretion process in AGN galaxies is fueled by the availability of gas and dust, which are essential for both star formation and black hole growth. The higher SFR in AGN galaxies indicates a higher abundance of gas and dust, providing the necessary fuel for both processes to occur concurrently. The interaction between the inflowing material and the central black hole not only powers the AGN but also triggers and enhances star formation activity in the surrounding regions.
In contrast, normal galaxies show a higher prevalence at lower SFR, indicating a lower level of ongoing star formation. This could be attributed to various factors such as the depletion of gas reservoirs, a less favorable environment for star formation, or a transition to a more quiescent phase of galactic evolution. Normal galaxies may have already consumed a significant portion of their available gas or experienced a decline in the influx of fresh gas, leading to a reduced SFR.
In summary, the higher distribution of AGN galaxies at higher SFR suggests a close relationship between AGN activity and ongoing star formation. The concurrent presence of active black hole accretion and star formation processes in AGN galaxies indicates a shared fuel source, likely abundant gas and dust. On the other hand, normal galaxies exhibit a higher prevalence at lower SFR, suggesting a decrease in star formation activity, potentially due to gas depletion or a shift towards a more quiescent evolutionary phase.
4. Conclusion
In this study, the influence of host galaxy properties on X-ray active galactic nuclei (AGN) clusters was explored. Dependencies on luminosity, stellar mass, and star formation rate were investigated while comparing them with non-AGN clusters. By integrating multiwavelength galaxy data and utilizing the CIGALE code for SED fitting, comprehensive insights into the correlation and relationship between AGN clusters and host galaxy properties were obtained.
Our analysis revealed significant associations between luminosity, stellar mass, and star formation rate, providing valuable understanding of AGN activity. Furthermore, the comparison with non-AGN clusters uncovered distinctive characteristics, shedding light on the unique nature of AGN clusters.
In our study examining the dependence of AGN clusters on host galaxy properties, several key observations were made. First, when investigating the relationship between AGN clusters and luminosity, significant differences in their populations across various luminosity levels were observed. Interestingly, a large number of AGN clusters were concentrated in the middle range of luminosity for both low and high redshift classifications. Second, with respect to the dependence of AGN clusters on stellar mass, our results indicated that galaxies hosting AGNs detected in X-ray emission tended to fall within a specific range of stellar mass, between 10 and 11 (measured in . This range was populated by a significant proportion of AGN galaxies, regardless of their redshift classification. Finally, when examining the dependence of AGN clusters on star formation rate (SFR), a significant population of X-ray AGN concentrated within the SFR range of 1.5-2.5 (expressed in )) in both the low and high redshift regions.
In our analysis, various aspects of AGN clusters were explored, including their luminosity, stellar mass, and star formation rate (SFR). Starting with luminosity, a consistent increase in mean stellar mass was discovered as luminosity increased for both low and high redshifts. This positive correlation indicates that AGN with higher luminosities tend to be hosted by galaxies with larger stellar masses. Additionally, the relationship between SFR and stellar mass across different redshift regions was examined, revealing a positive correlation in both cases. This suggests that galaxies with higher stellar masses tend to exhibit higher levels of star formation. Furthermore, our analysis revealed a positive correlation between mean luminosity and SFR in both redshift regions, emphasizing their interconnected nature.
Moving on, the clustering of X-ray selected AGN was compared with that of normal galaxies. To ensure a fair comparison, galaxy samples were constructed to match the stellar mass, luminosity, and SFR distribution of the X-ray dataset. This approach controlled for potential biases and isolated the influence of AGN presence on clustering. Our findings demonstrated that both AGN and normal galaxies exhibited dependence on galaxy properties in terms of clustering, but degree of their dependance is different in different galaxy property values. The AGN distribution peaked at higher luminosity levels, while the normal galaxy distribution peaked at lower luminosity. Furthermore, it was observed that the peak of the AGN distribution occurred at lower stellar masses (up to a logarithm of 10.3 in units), whereas the distribution of normal galaxies reached its peak at higher stellar masses (up to a logarithm of 11.3). Regarding SFR, our analysis revealed that the distribution of AGN galaxies exhibited a peak at higher SFR levels, while the distribution of normal galaxies showed a peak at lower SFR levels.
As generally, by examining the dependencies on luminosity, stellar mass, and star formation rate, this study offers valuable insights into the correlation and relationship between AGN clusters and their host galaxies. The observed significant associations between AGN luminosity, stellar mass, and star formation rate highlight the importance of these factors in AGN activity. Additionally, the comparison with non-AGN clusters provides a unique perspective on the distinctive nature of AGN clusters. The division into different redshift groups and the categorization of host galaxy properties further enhance the depth of analysis, allowing for a comprehensive evaluation of the individual effects of these properties on AGN clusters. Overall, these results bridge the existing knowledge gap and advance our understanding of the complex relationship between AGN clusters and host galaxy properties in the field of astrophysics.
Based on the findings and significance of this study, several recommendations emerge for future research in the field of AGN clusters and host galaxy properties. Firstly, it is recommended to expand the sample size of AGN clusters to further validate the observed associations between luminosity, stellar mass, and star formation rate. This will enhance the statistical robustness of the results and provide a more comprehensive understanding of AGN activity. Additionally, future studies should explore other host galaxy properties, such as morphology, gas content, and environment, to uncover further insights into the unique nature of AGN clusters. Incorporating these additional properties will contribute to a holistic understanding of the factors influencing AGN activity.
Furthermore, it is recommended to investigate the evolutionary aspects of AGN clusters by studying their temporal variations and examining the connections between AGN activity and galaxy evolution processes. This will provide deeper insights into the co-evolution of AGNs and their host galaxies. Lastly, the utilization of advanced observational facilities and techniques, such as upcoming space missions and next-generation telescopes, should be considered to enhance the observational capabilities and resolution in studying AGN clusters and their host galaxy properties. By addressing these recommendations, future studies will further advance our understanding of AGN clusters and their relation to host galaxy properties, paving the way for more comprehensive analyses and breakthroughs in the field of astrophysics.